
Vitamin D Insufficiency/Deficiency Management
South Med J. 2014;107(2):66-70.
Abstract and Introduction
Abstract
Objectives: In recent years, vitamin D deficiency has been recognized increasingly often in patients, and different supplement regimens have been prescribed to treat it. There has been no consensus on treatment regimens. This study was conducted to determine the management of vitamin D deficiency/insufficiency in outpatient adults in northeast Tennessee.
Methods: A retrospective record review was conducted in an internal medicine teaching clinic for patients seen from July 2007ľJuly 2008 in Johnson City, Tennessee. A total of 626 nonelectronic charts listed with vitamin D measurements were used in the analysis. Data regarding the level of vitamin D, whether treatment was prescribed, dose and duration of treatment prescribed, and repeat levels of vitamin D, if any were ordered, were collected. Vitamin D deficiency was defined as levels <20 ng/mL; vitamin D insufficiency was defined as levels ranging from 20 to 29.9 ng/mL.
Results: Of the 626 patients, 325 (52%) were vitamin D deficient or insufficient. Of these 325 patients, 184 were given a low-dose supplement and 54 received a high-dose supplement. Eighty-seven were either not prescribed any replacement or the dose was unknown (not documented in the chart). The mean change in serum vitamin D levels was significantly different for the high dose compared with the low dose prescribed. There was no significant sex difference in response to the dose given. On average, those who were vitamin D deficient experienced a greater change than those who were insufficient and a greater change, on average, was observed in those who received a higher dose.
Conclusions: Vitamin D deficiency and insufficiency are highly prevalent. Clinicians tended to prescribe a high dose of treatment for lower levels of serum vitamin D. The response is higher in high-dose treatment. Documentation regarding whether vitamin D supplements were given or the dose of supplements was given and followed up with repeat levels of vitamin D after treatment was poor.
Introduction
Vitamin D deficiency has been a topic of interest and much research in the last decade. Numerous articles have been published establishing its widespread insufficiency and deficiency, association with various medical conditions, different serum levels of importance, and the supplement dosage indicated.[1ľ11]
Vitamin D deficiency results from lower vitamin D intake (decreased intake of vitamin-rich foods and lack of fortified foods), lack of exposure to sunlight (especially in winter months), reduced skin synthesis (using sunscreen for prevention of skin cancer or having older adult skin), nephritic syndromes, chronic renal disease, liver failure, malabsorption, and the use of medications that increase catabolism (eg, steroids, anticonvulsants).[6ľ8] Vitamin D deficiency contributes to bone loss and is implicated in many medical conditions, including osteopenia, osteoporosis, falls, type 1 diabetes mellitus, insulin resistance, obesity, common solid cancers, cardiovascular disease, hypertension, multiple sclerosis, deregulated immune function, asthma, and increased infection rates.[5ľ7,9,10] Although the implications of the deficiency are not fully known, there is consensus that vitamin D deficiency should be treated with supplements. Appropriate thresholds for treatment and replacement doses are unclear, however. The literature is limited on treatment of vitamin D deficiency in ambulatory medical practice. No clinical trials demonstrate that treatment of vitamin D improves clinical outcomes in general populations; however, organizations such as The Endocrine Society recommend treatment of vitamin D deficiency.[8] As such, it is relevant to know how practicing physicians manage this problem. Previous work has demonstrated that vitamin D deficiency was prevalent among inpatients from northeast Tennessee.[7] We believed that this deficiency also was likely prevalent among outpatients and that it was underrecognized and undertreated. The purpose of this study was to explore how vitamin D deficiency was diagnosed, treated, and followed up in an internal medicine outpatient setting in northeast Tennessee.
Methods
A total of 626 nonelectronic charts of outpatients seen in an internal medicine teaching clinic from July 2007 through July 2008 in Johnson City, Tennessee, were reviewed. These charts were selected based on all of the vitamin D levels that were performed/tested in the laboratory affiliated with the clinic. The patients attending the clinic represented the general population, were adults, and included healthy people who came for routine preventive care, as well as those who sought treatment for various medical problems. The tests were ordered primarily by internists who worked in the clinic affiliated with the university, but they also included tests ordered by physicians in the specialties of endocrinology, rheumatology, allergy-immunology, and dermatology.
Data regarding the level of 25-hydroxyvitamin D (OH) vitamin D, whether treatment was prescribed, dose and duration of treatment were prescribed, and repeat levels of vitamin D, if any were ordered, were collected. The study was approved by the institutional review board and needed no funding. The authors were solely responsible for the study design. As in our previous study and others,[4,7ľ9] we defined vitamin D deficiency as values <20 ng/mL and vitamin D insufficiency as 20 to 29.9 ng/mL.
High-dose replacement was defined as a vitamin D supplement of 50,000 IU/week or higher; all of the rest (supplements in the range of 400ľ5000 IU/day) were considered low dose. These definitions were chosen based on the distribution of our data and The Endocrine Society guidelines.[8] If there was no mention of supplement in the chart (either ordered or advised to the patient to be taken over the counter), it was considered that the patient had not taken vitamin D supplements. The sex of the patient was also recorded. The data were not analyzed separately for sex because of the relatively small number of men in the population measured. Similarly, racial differences were not analyzed because African Americans compose only approximately 3% of the northeast Tennessee population.
A χ2 test of independence (P < 0.0001) was used to evaluate whether the dose prescribed was independent of insufficiency or deficiency; it also was used to evaluate the sex distribution of insufficiency and deficiency. A correlation coefficient was used to examine the relation between change in vitamin D level and supplement dose. The other statistical analyses were based on analysis of variance.
Results
summarizes the sex distribution of patients with low vitamin D levels; these levels were measured in more women than men. There were similar proportions of deficiency and insufficiency in men and women (χ2 = 1.049; P = 0.305). Approximately half of those with low levels were deficient.
Table 1. Patients classified by sex and condition
| Sex | Insufficiency vitamin D, 20ľ29.9 ng/mL | Deficiency (≤20) vitamin D, <20 ng/mL |
|---|---|---|
| Female (%) | 133 (50.38) | 131 (49.62) |
| Male (%) | 35 (57.38) | 26 (42.62) |
χ2 = 1.049, df 1; P = 0.305.
summarizes the vitamin D replacement doses by vitamin D levels. One-fourth of those with low vitamin D levels had no documentation of vitamin D replacement. Those with vitamin D deficiency were significantly more likely to receive high-dose replacement than those with insufficiency (χ2 = 240.1; P < 0.0001); however, when the use of vitamin D levels as a continuous variable was analyzed, no specific threshold was identified below which high-dose treatment was consistently used (Fig. 1).
Table 2. Patients classified by condition and dose prescribed
| Condition | Dose prescribed | ||
|---|---|---|---|
| None or unknown | Low | High | |
| Insufficiency (%) | 64 (38.1) | 96 (57.1) | 8 (4.8) |
| Deficiency (%) | 23 (14.7) | 88 (56.0) | 46 (29.3) |
χ2 = 240.1, df 2; P < 0.0001.
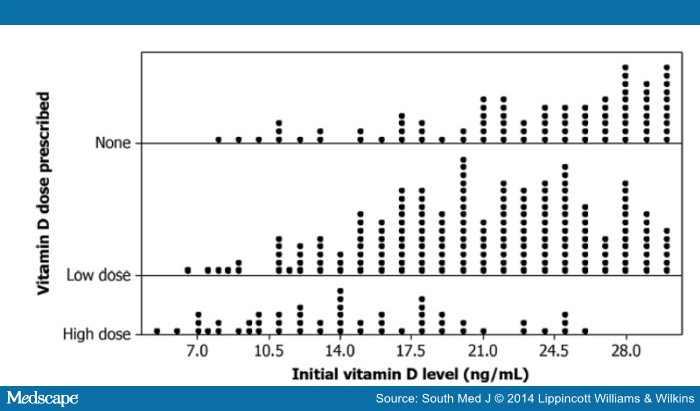
Figure 1.
Initial vitamin D levels and dose prescribed.
Of the 325 patients who were vitamin D deficient or insufficient, only the charts of 110 showed a second measure of vitamin D. For these patients, the change in level of vitamin D () was significantly greater (F = 13.96; P < 0.0001) for high-dose replacement than for low-dose replacement or no replacement. There was, however, no significant difference in change between low dose and no replacement and no significant relation between sex and dose or sex and change in vitamin D level (data not shown).
Table 3. Initial vitamin D levels and change in level by condition and dose received
| Dose | Variable measured | Deficiency | Insufficiency | ||||
|---|---|---|---|---|---|---|---|
| n | Mean, ng/mL | SD | n | Mean, ng/mL | SD | ||
| No dose | Initial vitamin D | 22 | 14.8 | 3.7 | 64 | 26.2 | 3.02 |
| Repeated | 4 | 26.2 | 9.4 | 9 | 36.2 | 6.6 | |
| Change | 4 | 12.2 | 7.4 | 9 | 10.1 | 8.9 | |
| Low | Initial vitamin D | 84 | 16 | 3.5 | 96 | 25.2 | 2.7 |
| Repeated | 35 | 33 | 10 | 30 | 36.1 | 12.1 | |
| Change | 35 | 17.2 | 10.1 | 30 | 11.3 | 12.3 | |
| High | Initial vitamin D | 45 | 13 | 4.2 | 8 | 24 | 1.6 |
| Repeated | 26 | 41.9 | 9.7 | 6 | 43 | 22.2 | |
| Change | 26 | 28.6 | 10.5 | 6 | 18.5 | 21.9 | |
Relation between initial vitamin D and change: F = 3.92, df 1; P = 0.05; relation between dose and change: F = 5.87, df 2; P = 0.004.
The correlation coefficient (R 2 = 0.2069) for the relation between vitamin D dose and change in vitamin D level indicates that only approximately 21% of the variability in change in vitamin D is explained by the different doses given. Fig. 2 demonstrates that much individual variability is not explained by the vitamin D dose recorded in the chart. Other possible causes of this variation may include supplements, seasonal variation, or randomness.
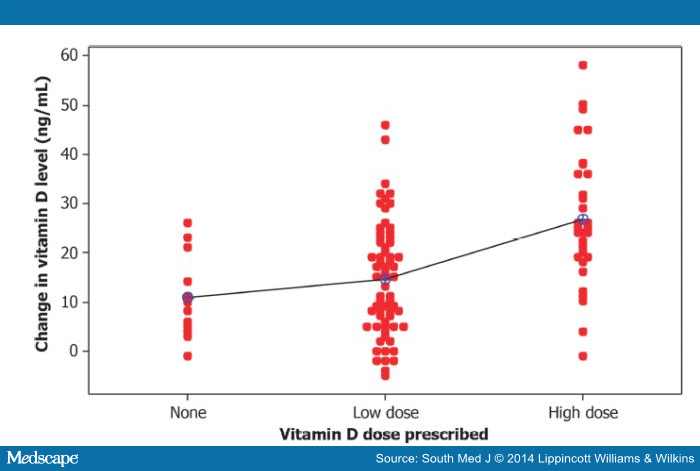
Figure 2.
Individual differences (afterľbefore) by dose prescribed.
The two-way analysis of variance indicates that the initial vitamin D level (whether deficient or insufficient) has an effect on the change in vitamin D level (F = 3.92; P = 0.05), as seen in . Patients with vitamin D deficiency tend to have a greater increase in vitamin D levels following treatment than those with vitamin D insufficiency. The dose of the supplement given also has a significant effect in change of vitamin D level (F = 5.87; P = 0.004). Fig. 3 shows that patients with deficiency experience a greater change on average than those with insufficiency and those who receive a higher dose experience a greater increase on average in the level of vitamin D. There is no significant difference in the change in vitamin D between the group that received no supplements and that which received low-dose supplements; however, with only four patients who received no supplements noted as having a repeat level, the power of finding a difference, even if present, is low.
Table 3. Initial vitamin D levels and change in level by condition and dose received
| Dose | Variable measured | Deficiency | Insufficiency | ||||
|---|---|---|---|---|---|---|---|
| n | Mean, ng/mL | SD | n | Mean, ng/mL | SD | ||
| No dose | Initial vitamin D | 22 | 14.8 | 3.7 | 64 | 26.2 | 3.02 |
| Repeated | 4 | 26.2 | 9.4 | 9 | 36.2 | 6.6 | |
| Change | 4 | 12.2 | 7.4 | 9 | 10.1 | 8.9 | |
| Low | Initial vitamin D | 84 | 16 | 3.5 | 96 | 25.2 | 2.7 |
| Repeated | 35 | 33 | 10 | 30 | 36.1 | 12.1 | |
| Change | 35 | 17.2 | 10.1 | 30 | 11.3 | 12.3 | |
| High | Initial vitamin D | 45 | 13 | 4.2 | 8 | 24 | 1.6 |
| Repeated | 26 | 41.9 | 9.7 | 6 | 43 | 22.2 | |
| Change | 26 | 28.6 | 10.5 | 6 | 18.5 | 21.9 | |
Relation between initial vitamin D and change: F = 3.92, df 1; P = 0.05; relation between dose and change: F = 5.87, df 2; P = 0.004.
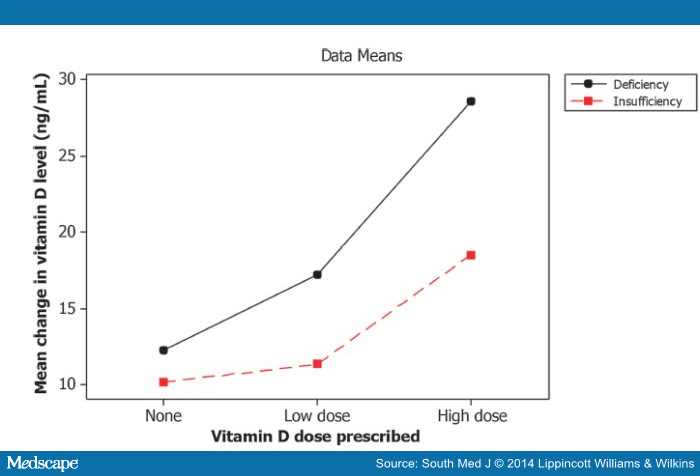
Figure 3.
Interaction plot for change in vitamin D after treatment.
Discussion
There is consensus that low levels of vitamin D are prevalent and that vitamin D deficiency is associated with abnormalities in bone metabolism and increased risk of falls.[8,10] The published guidelines for treatment of vitamin D deficiency vary among different organizations, however.[2]
Vitamin D deficiency is highly prevalent; in the present study 52% of the 626 charts documented either deficiency or insufficiency. Higher doses tended to be used to treat deficiency rather than insufficiency, although treatment was not always documented. The high dose was prescribed more in deficient patients when compared with insufficient patients (46 vs 8), although being deficient did not necessarily result in receiving high-dose treatment. Of the 157 patients who had vitamin D deficiency, 46 received a higher dose, whereas 88 received a lower dose of vitamin D. The failure to document treatment occurred less often in vitamin D deficiency than in insufficiency.
Physician practices were highly variable, with some physicians prescribing high-dose treatment for mild insufficiency and others prescribing low-dose treatment for severe deficiency. The number of follow-up measurements after supplementation was poor, with only 110 of the 325 patients undergoing a second measure of vitamin D. There was no significant difference between sex and dose consideration and response to vitamin D supplement.
On average, patients with vitamin D deficiency experienced a greater change than those with insufficiency and those who received a higher dose had a greater increase, on average, in the level of vitamin D.
Dunlop and Rudenko noted that, in general, 1000 IU/day vitamin D increased the level by 10 ng/dL after 4 months of treatment, and that a large dosage given either monthly or weekly produced approximately the same results as a smaller dosage given daily.[4] Diamond et al stated that treatment with 5000 IU/day for 3 months was more effective than 2000 IU/day in achieving optimal 25-OH vitamin D levels, with an 82.7% increase in the 2000-IU group compared with 219.5% in the 5000-IU group.[1]
Ameri et al reported that the delivery of skin-derived vitamin D to the liver was slower and, thus, had more of a sustained increase in the 25-OH vitamin D level when compared with ingested vitamin D.[3] They did not notice any difference between doses of 5000 and 7000 IU/week in increasing the vitamin D levels; however, their cohort was small, consisting of only 16 patients. Glendenning and Inderjeeth[5] reported that higher therapeutic doses may be detrimental, and two observational studies have suggested a reverse J-shaped association between vitamin D levels and mortality.[12,13] These studies found the highest mortality levels at low vitamin D levels and the lowest mortality at levels ranging from 50 to 80 nmol/L, with increasing mortality at levels in the 110- to 120-nmol/L range. Moyer noted an increased risk for nephrolithiasis, as reported by the Women's Health Initiative trial, with the use of vitamin D and calcium supplementation to prevent fractures in adults, although it is uncertain whether this adverse effect occurs in vitamin Dľdeficient populations.[10] Although these were not treatment studies, these reports raise the possibility that large doses of vitamin D have the potential to harm if they result in the highest-range vitamin D levels noted in these studies. Findlay et al summarized the recommendations of various groups for treatment of vitamin D deficiency.[2] Loading dose recommendations varied from no recommendation to 60,000 IU/week for 8 to 12 weeks. Maintenance dose recommendations varied from 800 to 2200 IU/day, 10,000 IU/week, or 50,000 IU every 2 to 4 weeks.
Reeder et al reported that 50% of New Zealand general practitioners who participated in a study endorsed 50,000 IU/month vitamin D supplements and 47% endorsed vitamin Dľfortified food or low-dose (≤2000 IU) vitamin D as a preventive strategy.[11] They also indicated that 50,000 IU/month of vitamin D is the treatment strategy for insufficiency and deficiency in New Zealand, but the duration of the treatment was not specified.
Several limitations of the present study are noted. It was a retrospective study; therefore, other variables that may affect vitamin D levels were uncontrolled. Many times the dose was not documented. The physicians who prescribed vitamin D included both general internists and subspecialists and their styles of treatment may have differed. There were no data on whether the patients were taking other supplements, including vitamin D in multivitamins, which would have affected the vitamin D levels. The patient population included all patients presenting in the clinic, including healthy adults and patients with various medical problems, which may have affected the absorption of the supplement. Compliance with treatment was not assessed. The fact that patients classified in the no-dose category may have taken some type of supplement that was not documented may confound the interpretation of the data; however, few patients in this category had repeat vitamin D levels, so this has no practical implications related to interpreting change in vitamin D levels.
Conclusions
Low vitamin D levels were common in this population of internal medicine outpatients, with one-fourth of patients being deficient and another one-fourth being insufficient. Both groups demonstrated an increase in vitamin D level in response to high or low doses of vitamin D supplements; however, the response was more marked with higher doses in deficient patients. In spite of this, a large number of patients are still not treated. This was truer in patients with insufficient levels, but it also was seen in those who were deficient. Documentation of vitamin D supplements provided was poor. Follow-up measurements of the vitamin D level were not performed in a significant number of patients.
It is recommended that a low threshold be maintained for measuring vitamin D levels, given the frequency of vitamin D deficiency, treatment carefully documented in the medical records, and more vigilance exercised regarding follow-up of the treatment given.
References
Diamond T, Wong YK, Golombick T. Effect of oral cholecalciferol 2,000 versus 5,000 IU on serum vitamin D, PTH, bone and muscle strength in patients with vitamin D deficiency. Osteoporos Int 2013;24:1101ľ1105.
Findlay M, Anderson J, Roberts S, et al. Treatment of vitamin D deficiency: divergence between clinical practice and expert advice. Postgrad Med J 2012;88:255ľ260.
Ameri P, Bovio M, Murialdo G. Treatment for vitamin D deficiency: here and there do not mean everywhere. Eur J Nutr 2012;51:257ľ259.
Dunlop D, Rudenko A. Correcting vitamin D deficiency using over-the-counter supplements. Consult Pharm 2012;27:286ľ289.
Glendenning P, Inderjeeth CA. Vitamin D: methods of 25 hydroxyvitamin D analysis, targeting at risk populations and selecting thresholds of treatment. Clin Biochem 2012;45:901ľ906.
Holick MF. High prevalence of vitamin D inadequacy and implications for health. Mayo Clin Proc 2006;81:353ľ373.
Kuriacose R, Olive KE. Prevalence of vitamin D deficiency and insufficiency in northeast Tennessee. South Med J 2008;101:906ľ909.
Holick MF, Binkley NC, Bischoff-Ferrari HA, et al. Evaluation, treatment, and prevention of vitamin D deficiency: an Endocrine Society clinical practice guideline. J Clin Endocrinol Metab 2011;96:1911ľ1930.
Souberbielle JC, Courbebaisse M, Cormier C, et al. When should we measure vitamin D concentration in clinical practice? Scand J Clin Lab Invest Suppl 2012;243:129ľ135.
Moyer VA, US Preventive Services Task Force. Vitamin D and calcium supplementation to prevent fractures in adults: U.S. Preventive Services Task Force recommendation statement. Ann Intern Med 2013;158:691ľ696.
Reeder AI, Jopson JA, Gray AR. Vitamin D insufficiency and deficiency: New Zealand general practitioners' perceptions of risk factors and clinical management. N Z Med J 2013;126:49ľ61.
Durup D, Jorgensen HL, Christensen J, et al. A reverse J-shaped association of all-cause mortality with serum 25-hydroxyvitamin D in general practice: the CopD study. J Clin Endocrinol Metab 2012;97:2644ľ2652.
Sempos CT, Durazo-Arvizu RA, Dawson-Hughes B, et al. Is there a reverse J-shaped association between 25-hydroxyvitamin D and all-cause mortality? Results from the U.S. nationally representative NHANES. J Clin Endocrinol Metab 2013;98:3001ľ3009.
The authors have no financial relationships to disclose and no conflicts of interest to report.
Acknowledgments
The authors thank Dr Edith Seier, professor in the Department of Mathematics and Statistics, East Tennessee State University, for assistance with the statistical analysis. We also thank staff members at the Johnson City Medical Center learning resources for assistance with the literature review.
South Med J. 2014;107(2):66-70. ę 2014